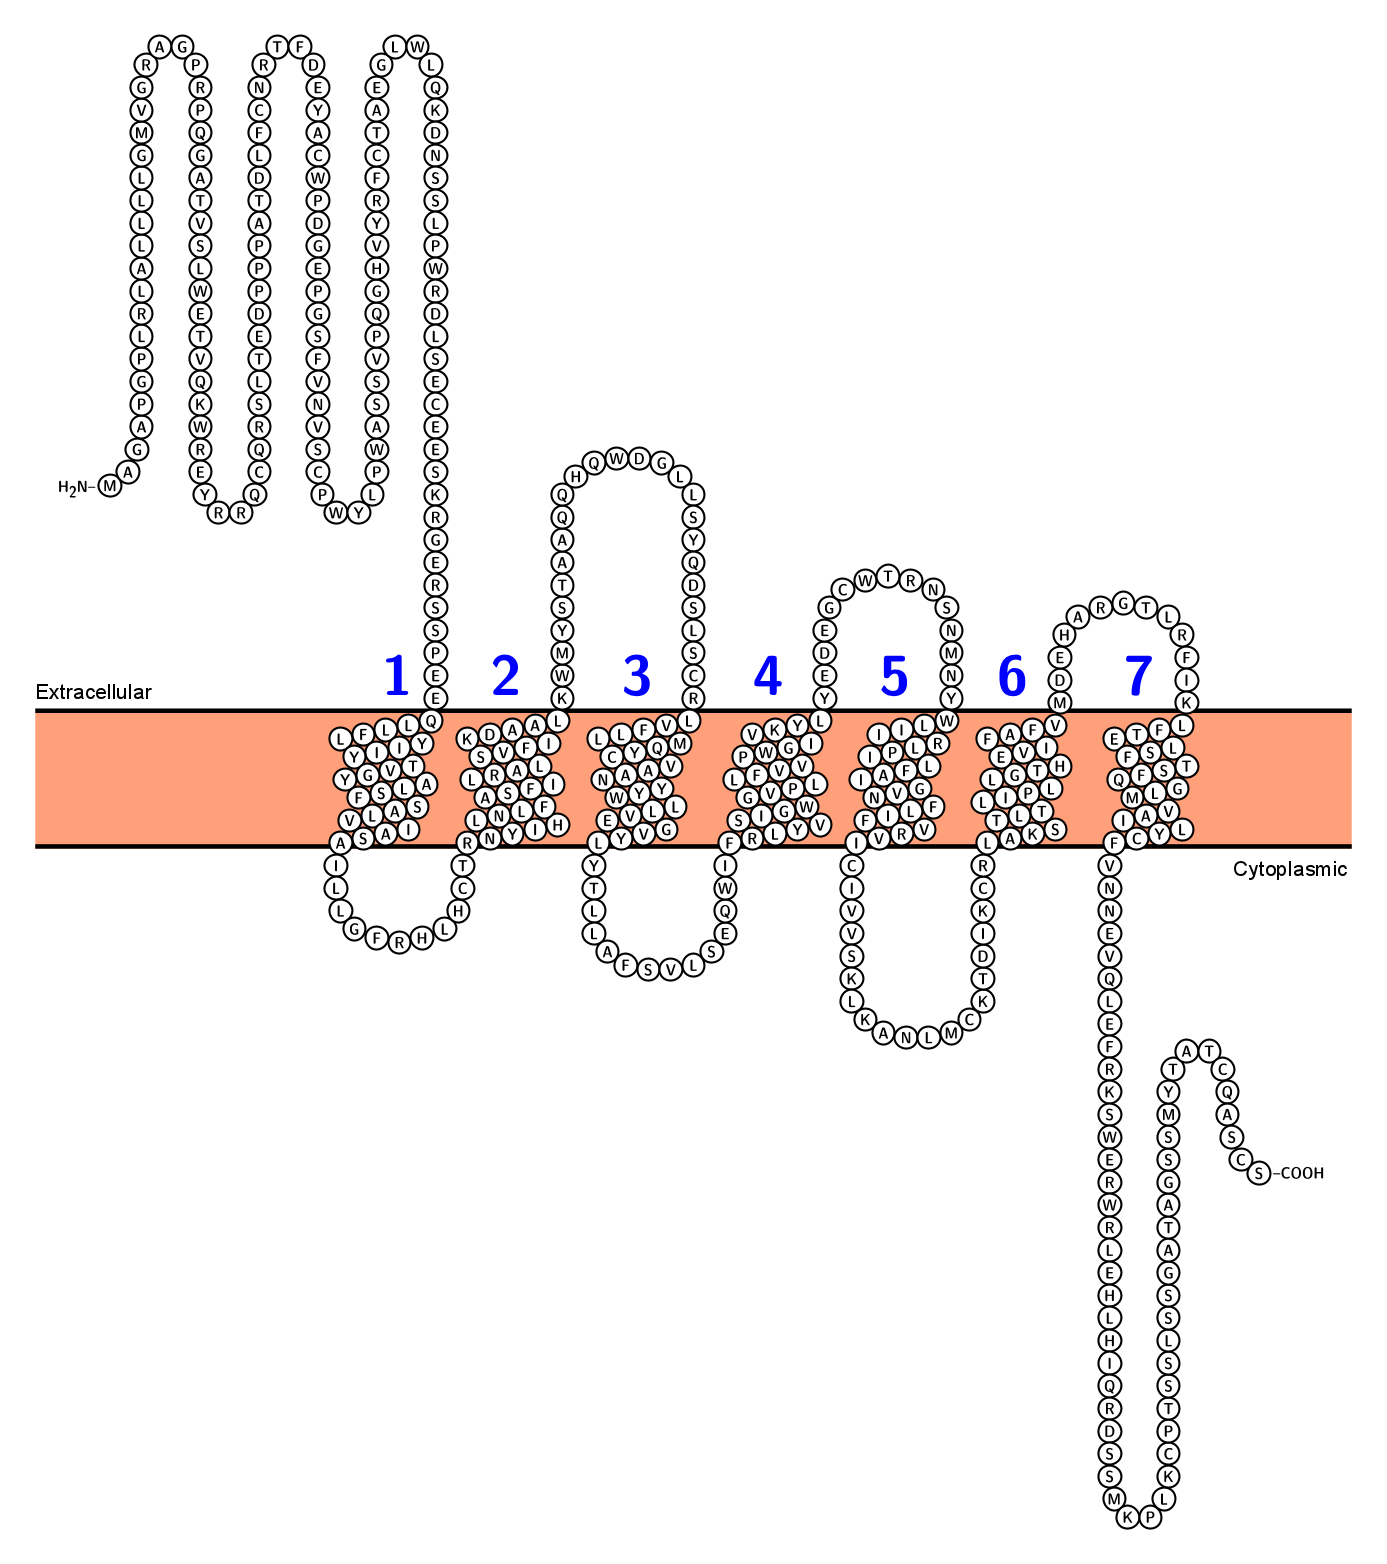
Glucagon-like peptide 1 receptor
Organism: Homo sapiens (Human) | Gene names: GLP1R
Entry: P43220
Mass: 53.026 Da
Transmembrane: 7
Subcellular location: Cell membrane {ECO:0000269|PubMed:19861722, ECO:0000269|PubMed:26308095, ECO:0000269|PubMed:27196125, ECO:0000269|PubMed:28514449, ECO:0000269|PubMed:7517895, ECO:0000269|PubMed:8216285, ECO:0000269|PubMed:8405712}, Multi-pass membrane protein {ECO:0000269|PubMed:28514449}.
Cofactor: -
Extinction coefficient: 2.372
Isoelectric Point: 8.49
PubMed ID: 8405712, 8404634, 8216285, 7517895, 7843404, 14574404, 15489334, 9213353, 20869417, 21901419, 22412906, 18287102, 19861722, 26308095, 27196125, 28514449
Function:
G-protein coupled receptor for glucagon-like peptide 1 (GLP-1) (PubMed:8405712, PubMed:8216285, PubMed:7517895, PubMed:19861722, PubMed:26308095, PubMed:27196125, PubMed:28514449). Ligand binding triggers activation of a signaling cascade that leads to the activation of adenylyl cyclase and increased intracellular cAMP levels (PubMed:8405712, PubMed:8216285, PubMed:7517895, PubMed:19861722, PubMed:26308095, PubMed:27196125, PubMed:28514449). Plays a role in regulating insulin secretion in response to GLP-1 (By similarity). {ECO:0000250|UniProtKB:O35659, ECO:0000269|PubMed:19861722, ECO:0000269|PubMed:26308095, ECO:0000269|PubMed:27196125, ECO:0000269|PubMed:28514449, ECO:0000269|PubMed:7517895, ECO:0000269|PubMed:8216285, ECO:0000269|PubMed:8405712}.
Data from experiment(s):
Involvement in disease:
-
Binding site:
-
Tissue specificity:
-
3D (X-ray crystallography):
X-ray crystallography (14); Electron microscopy (11)
Pharmaceutical use:
-
AS sequence:
MAGAPGPLRLALLLLGMVGRAGPRPQGATVSLWETVQKWREYRRQCQRSLTEDPPPATDLFCNRTFDEYACWPDGEPGSFVNVSCPWYLPWASSVPQGHVYRFCTAEGLWLQKDNSSLPWRDLSECEESKRGERSSPEEQLLFLYIIYTVGYALSFSALVIASAILLGFRHLHCTRNYIHLNLFASFILRALSVFIKDAALKWMYSTAAQQHQWDGLLSYQDSLSCRLVFLLMQYCVAANYYWLLVEGVYLYTLLAFSVLSEQWIFRLYVSIGWGVPLLFVVPWGIVKYLYEDEGCWTRNSNMNYWLIIRLPILFAIGVNFLIFVRVICIVVSKLKANLMCKTDIKCRLAKSTLTLIPLLGTHEVIFAFVMDEHARGTLRFIKLFTELSFTSFQGLMVAILYCFVNNEVQLEFRKSWERWRLEHLHIQRDSSMKPLKCPTSSLSSGATAGSSMYTATCQASCS
Creditnotes:
The protein visualizations are generated with the help of Protter:
Omasits, U., Ahrens, C.H., Müller, S., Wollscheid, B. “Protter: interactive protein feature visualization and integration with experimental proteomic data”. Bioinformatics. 2014 Mar 15; 30(6):884-6. doi: 10.1093/bioinformatics/btt607.
IP and extinction coefficients are gathered from Protparam by ExPASy:
Gasteiger, E., Hoogland, C., Gattiker, A., Duvaud, S., Wilkins, M.R., Appel, R.D., Bairoch, A. “Protein Identification and Analysis Tools on the ExPASy Server”. (In) John M. Walker (ed): The Proteomics Protocols Handbook, Humana Press (2005). pp. 571-607
The basic knowledge is found on UniProt:
The UniProt Consortium. “UniProt: the universal protein knowledgebase in 2021”. Nucleic Acids Res. 49:D1 (2021)
